Time Series Data Part 1: What is a Time Series?🔗

Time Series Data Overview🔗
We live in an age of data that we don't know how to sort through. It comes in many forms; there are pictures and purchases and google searches and blog posts floating around hard drives all over the world.
The focus of this will be on "Time Series" data; any data that is ordered by the passage of fixed periods of time. In other words: "Data you keep track of every X number of minutes (or weeks, or months!)"
Some real-world Time Series data examples:
- Weather history
- The average temperature of each day
- Energy Usage
- The average amount of electricity used by a city each day
- Stock price history
- Opening / Closing price of each day
- Purchase history
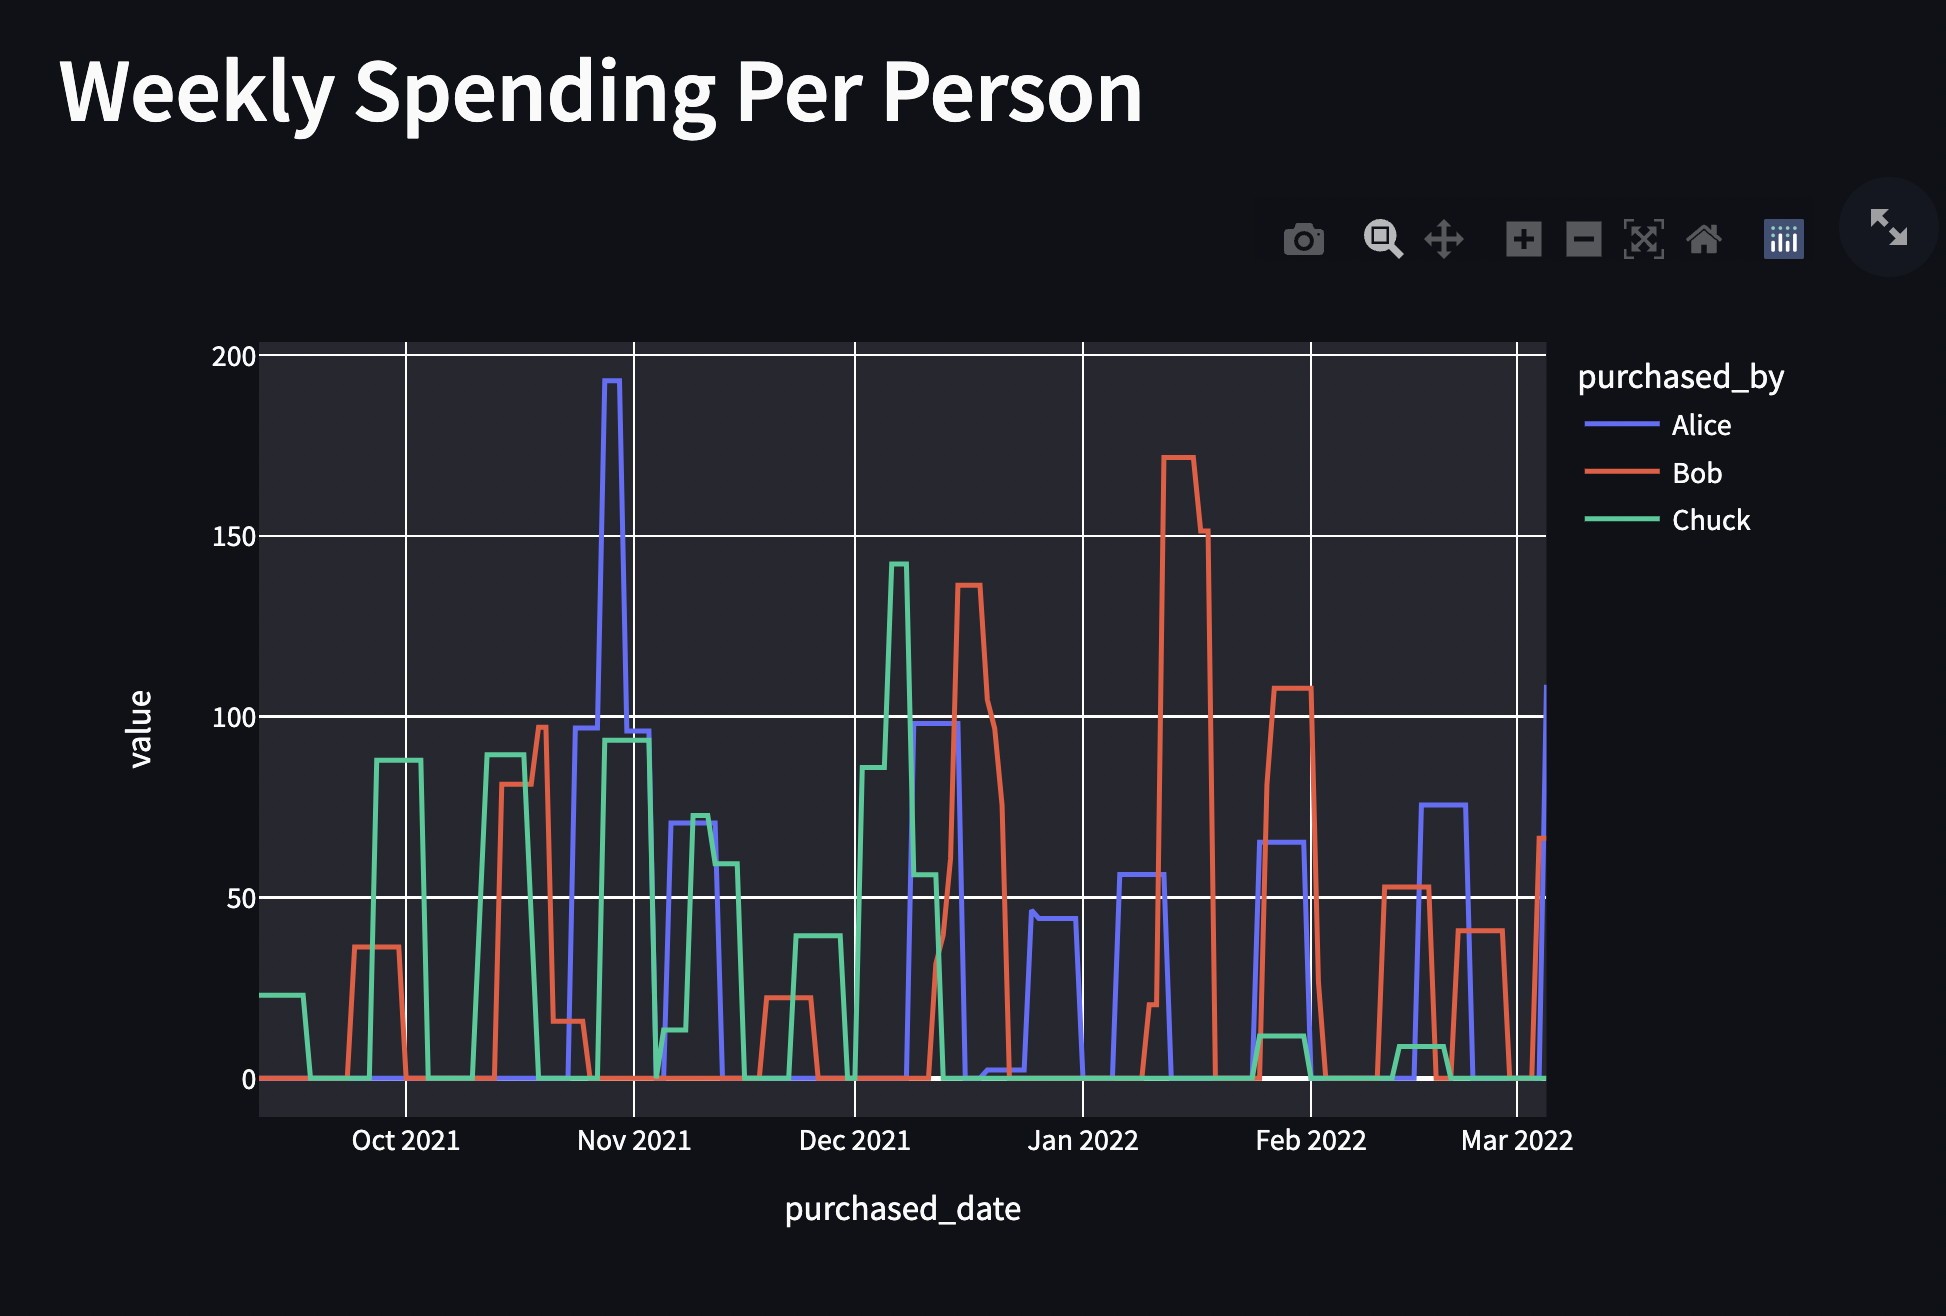
- Average number of purchases in each month
- Field sensor signals
- Average seismic readings in an area per hour
Mathematically speaking, we have example "observations" at each "period" of time. This can be represented like a list of values going back in time:
y_t, y_t-1, y_t-2, ... y_0
But before getting too deep into Time Series, what isn't a Time Series?
What isn't a Time Series?🔗
When developers think of "data", many will rightfully jump to "databases." Often used are relational SQL such as Postgres and MySQL. There are also many flavors of unstructured and columnar Non/NO-SQL databases.
Relational Data🔗
Relational data fits many normal business use cases, like keeping track of your employee / user / student data. Here's some relational data with 3 columns that holds some information about our users:
| id | name | favorite_food |
|---|---|---|
| 1 | Alice | Spam |
| 2 | Bob | Eggs |
Non-Relational Data🔗
Unstructured data fits many user-created use cases, like representing a blog post or user's settings.
VS Code handles non-default user preferences by adding to a JSON document. Here are some of mine:
| JSON | |
|---|---|
What's The Use of Time Series🔗
Time Series Forecasting🔗
One of the powers of Time Series data is the ability to predict the future! It's not possible in all cases of course, but that is the goal of Time Series "forecasting."
By analyzing the history and patterns of the data, a prediction can be made for one or more periods in the future.
This is incredibly powerful and used every day in real business scenarios. For example: using a businesses' historical sales to predict if they'll make enough to payback a bigger loan.
Mathematically this is represented as the result of a function on the present and previous observations. "Y Hat" is the predicted value of the next period.
y_hat_t+1 = g(t, y_t, y_t-1, y_t-2, ... y_0)
In python we might write a function like the following:
prediction = get_prediction(period, observations)
Many Time Series forecasts can be massively improved by data that is external to the raw observations. These external data are also passed to the prediction function and are often called "Covariates".
Quoting from the Python [Darts] library:
past covariates are (by definition) covariates known only into the past (e.g. measurements)
future covariates are (by definition) covariates known into the future (e.g., weather forecasts)
static covariates are (by definition) covariates constant over time. They are not yet supported in Darts, but we are working on it!
Unique Features of Time Series🔗
- Trend:
- Long term general direction
- Affects how we think about the data over longer periods
- Cyclicality
- Long horizon patterns of high-low-high movement
- Longer than years, which can usually fit in seasonality
- Seasonality
- Shorter periods of rising and falling movement
- Usually in sync with times of year
- Irregularity
- Random changes that don't fit the trend and cycle
Unforecastable Data🔗
These concepts just don't exist in Relational and Unstructured data. You couldn't predict anything about the future of our users' favorite foods just by looking at the table above.
(Note: If we also kept track of when each person's preference changed, then we would be able to create some Time Series data from that!)
Created: June 7, 2023